We really like the HPE ProLiant MicroServer Gen10 Plus that came out a little over a year ago. The idea was to pack the capabilities and power of a server into a tiny form factor that can be used in edge locations or just in offices that don’t have spaces for an entire rack setup. We went into some depth in our first review as well as a video on our YouTube channel. A few months later, we took this tiny server and installed TrueNas CORE to get impressive NAS capabilities into a small footprint that can handle it. While we know TrueNAS CORE 12 runs on the HPE ProLiant MicroServer Gen10 Plus, this review specifically looks at the performance the small server can offer and the impact certain features such as deduplication have on it.
We really like the HPE ProLiant MicroServer Gen10 Plus that came out a little over a year ago. The idea was to pack the capabilities and power of a server into a tiny form factor that can be used in edge locations or just in offices that don’t have spaces for an entire rack setup. We went into some depth in our first review as well as a video on our YouTube channel. A few months later, we took this tiny server and installed TrueNAS CORE to get impressive NAS capabilities into a small footprint that can handle it. While we know TrueNAS CORE 12 runs on the HPE ProLiant MicroServer Gen10 Plus, this review specifically looks at the performance the small server can offer and the impact certain features such as deduplication have on it.
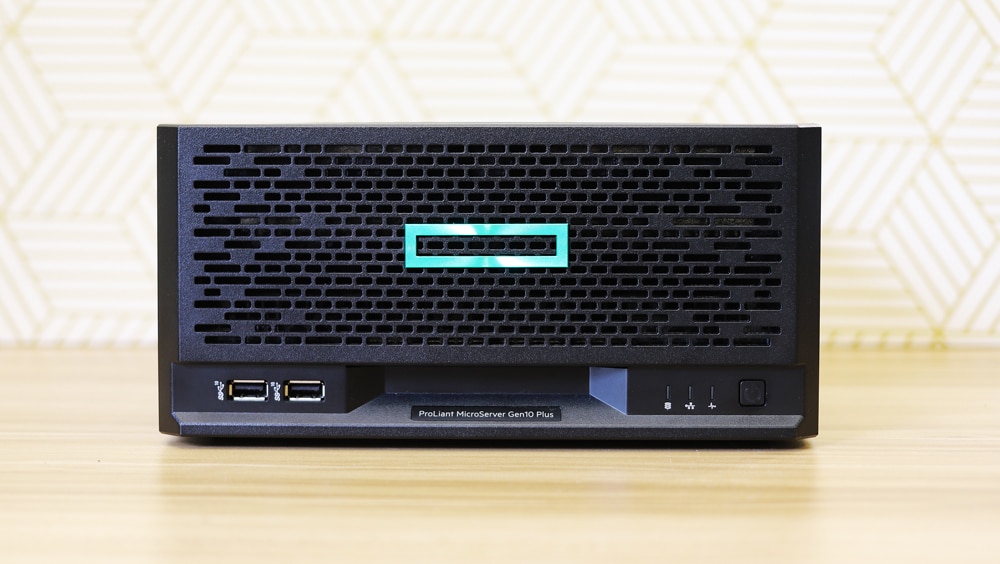
To recap, the HPE ProLiant MicroServer Gen10 Plus is a small server (4.68 x 9.65 x 9.65 in) that can still be outfitted with pretty high-end gear. There are four LFF drive bays in the front (not hot-swappable) that will fit SATA 3.5” HDDs or SATA 2.5” SSDs.
The MicroServer supports the Pentium G5420 or Xeon E-2224 CPU and up to 32GB of ECC RAM. In fact, it is highly customizable which is one of the reasons we love tinkering with it and the homelab community likes it so much. Aside from what can be installed on it to make it go zoom, the server also comes at an affordable price, floating on sale for around $600 with the Xeon CPU, which opens up many interesting doors.
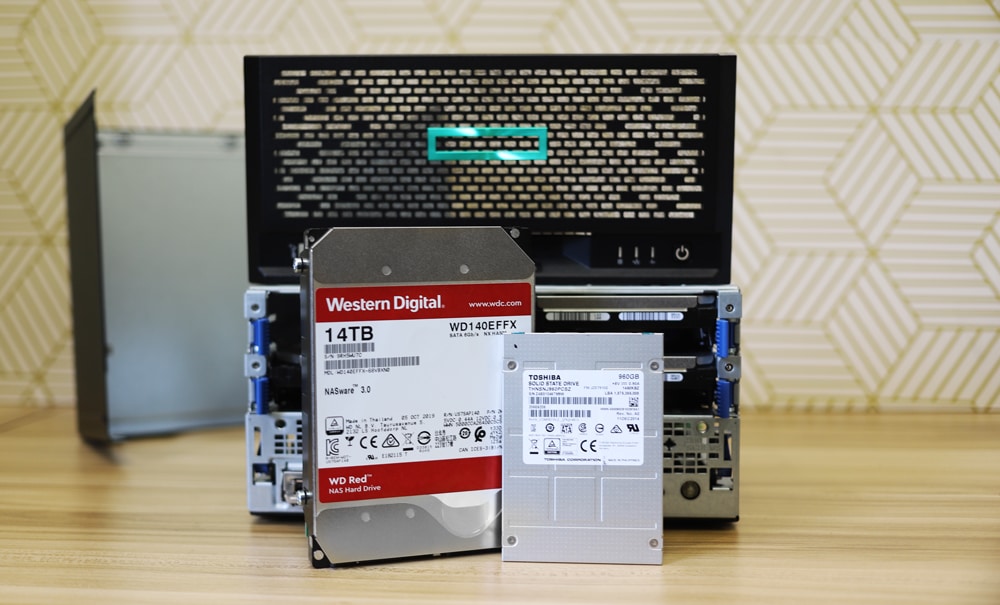
TrueNAS CORE 12 has a lot to offer, arguably one of the most comprehensive NAS software platforms. TrueNAS itself comes in a few flavors and is offered in both free (CORE) as well as commercial versions. The idea of using the HPE ProLiant MicroServer Gen10 Plus is that it can take advantage of just about everything TrueNAS CORE has to offer and is built on top of an enterprise-grade hardware platform from a Tier1 server vendor. While HPE offering a comprehensive server platform isn’t a surprise, the low entry cost of it is.
To get started, our friend Blaise gave us a handy walkthrough on how to install TrueNAS CORE.
HPE ProLiant MicroServer Gen10 Plus Specifications
| Processors | ||||||
| Models | CPU Frequency | Cores | L3 Cache | Power | DDR4 | SGX |
| Xeon E-2224 | 3.4 GHz | 4 | 8 MB | 71W | 2666 MT/s | No |
| Pentium G5420 | 3.8 GHz | 2 | 4 MB | 54W | 2400 MT/s | No |
| Memory | ||||||
| Type | HPE Standard MemoryDDR4 Unbuffered (UDIMM) | |||||
| DIMM Slots Available | 2 | |||||
| Maximum Capacity | 32GB (2 x 16GB Unbuffered ECC UDIMM @2666 MT/s) | |||||
| I/O | ||||||
| Video | 1 Rear VGA port1 Rear DisplayPort 1.0 |
|||||
| USB 2.0 Type-A Ports | 1 total (1 internal) | |||||
| USB 3.2 Gen1 Type-A Ports | 4 total (4 rear) | |||||
| USB 3.2 Gen2 Type-A Ports | 2 total (2 front) | |||||
| Expansion Slot | 1 x PCIe 3.0 x16 | |||||
| Network RJ-45 (Ethernet) | 4 | |||||
| Power Supply | One (1) 180 Watts , non-redundant External Power Adapter | |||||
| Server Power Cords | All pre-configured models ship standard with one or more country-specific 6 ft/1.83m C5 power cords depending on models. | |||||
| System Fans | One (1) non-redundant system fan shipped standard | |||||
| Power Supply | One (1) 180 Watts, non-redundant External Power Adapter | |||||
| Dimensions (H x W x D) (with feet) | 4.68 x 9.65 x 9.65 in (11.89 x 24.5 x 24.5 cm) | |||||
| Weight (approximate) | ||||||
| Maximum | 15.87 lb (7.2 kg) | |||||
| Minimum | 9.33 lb (4.23 kg) | |||||
TrueNAS CORE 12 Management
TrueNAS CORE has a lot to offer and will be best served by its own deep dive or video walkthrough. Perhaps soon we’ll unleash Blaise and let him go crazy on one. However, we would be remiss in our duties if we didn’t highlight some management features.
First up, it should be known that TrueNAS CORE is not the simplest or most intuitive NAS management, there are others out there that any person that can operate a smartphone could leverage. You did need a bit more skill and knowledge to effectively use TrueNAS, and that is ok because that is the user that can get the most out of it.
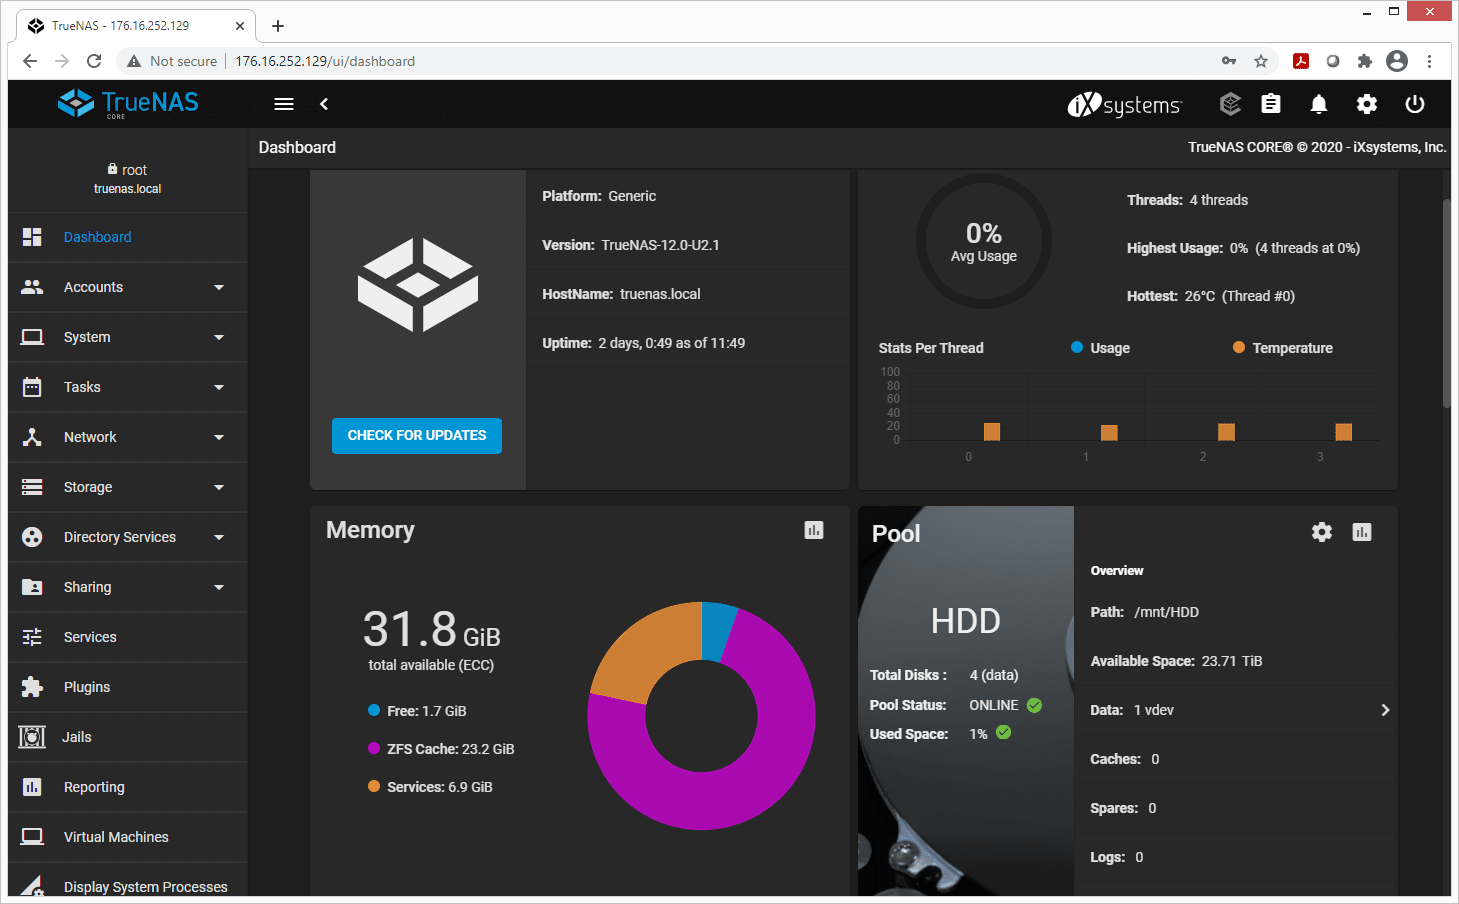
Let’s scratch the surface. The main screen of the GUI is the dashboard. Like most good GUIs, here we see general information on the hardware of the system. First, it pulls up the platform. Here it lists generic but would most likely say if it was an iXsystems platform. We also see the version, hostname, and uptime. The other three main blocks are dedicated to the processer, memory, and storage.
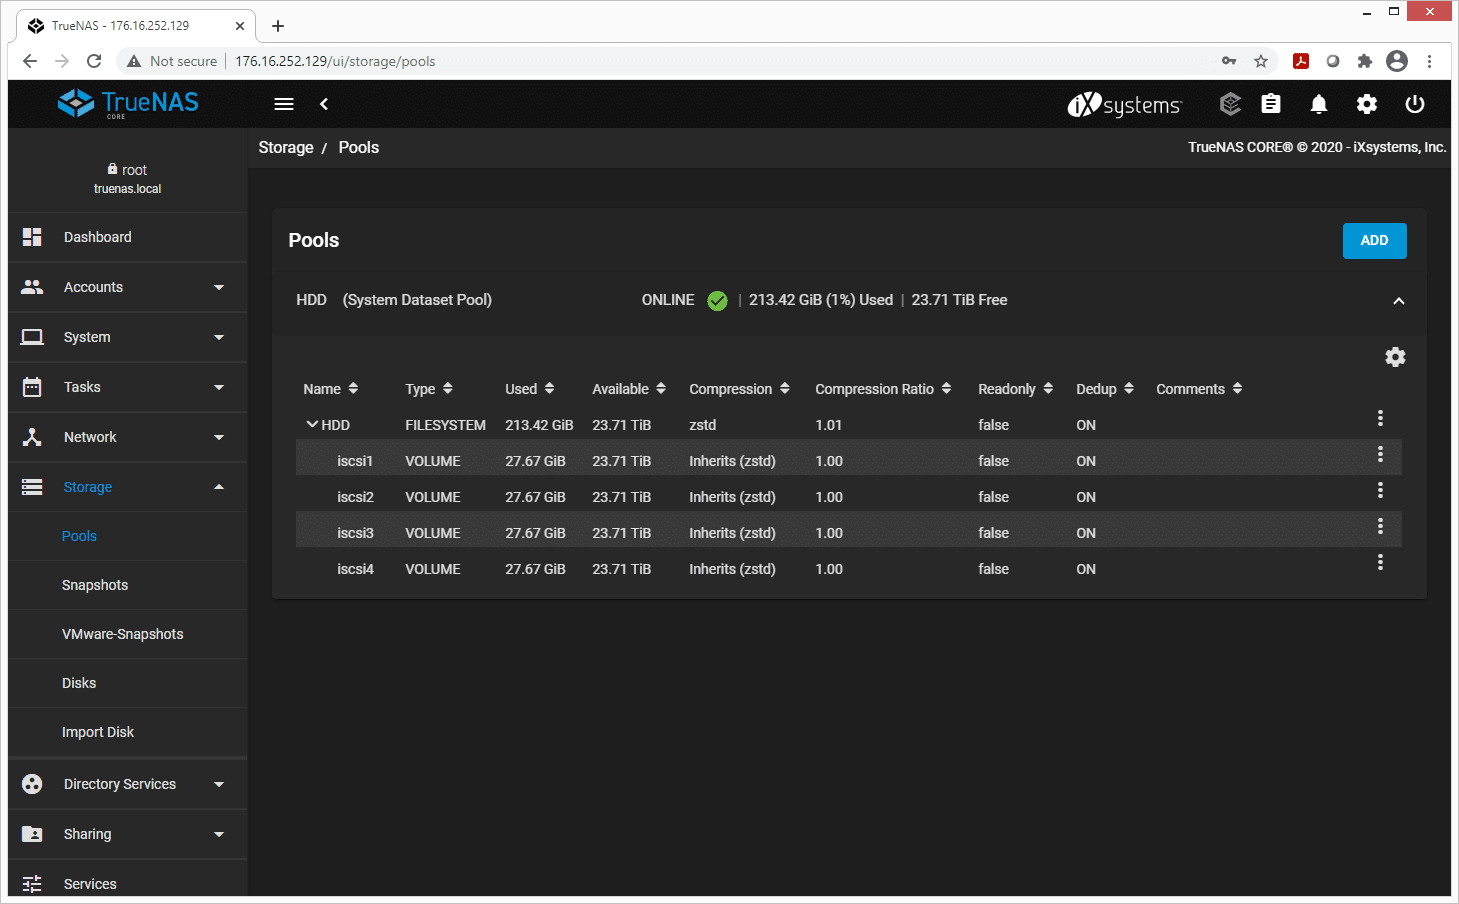
Since storage is a large part of what we test, let’s look there. Clicking on the main storage tab brings up five sub-tabs: Pools, Snapshots, VMware-Snapshots, Disks, and Import Disk. Clicking on the main tab brings us to pools. The example here is from our HDD setup and we can see the pool name, type, used capacity, available capacity, compression, and compression ratio, whether it is read-only or not, whether dedupe is on or not, and any comments the admin wants to add.
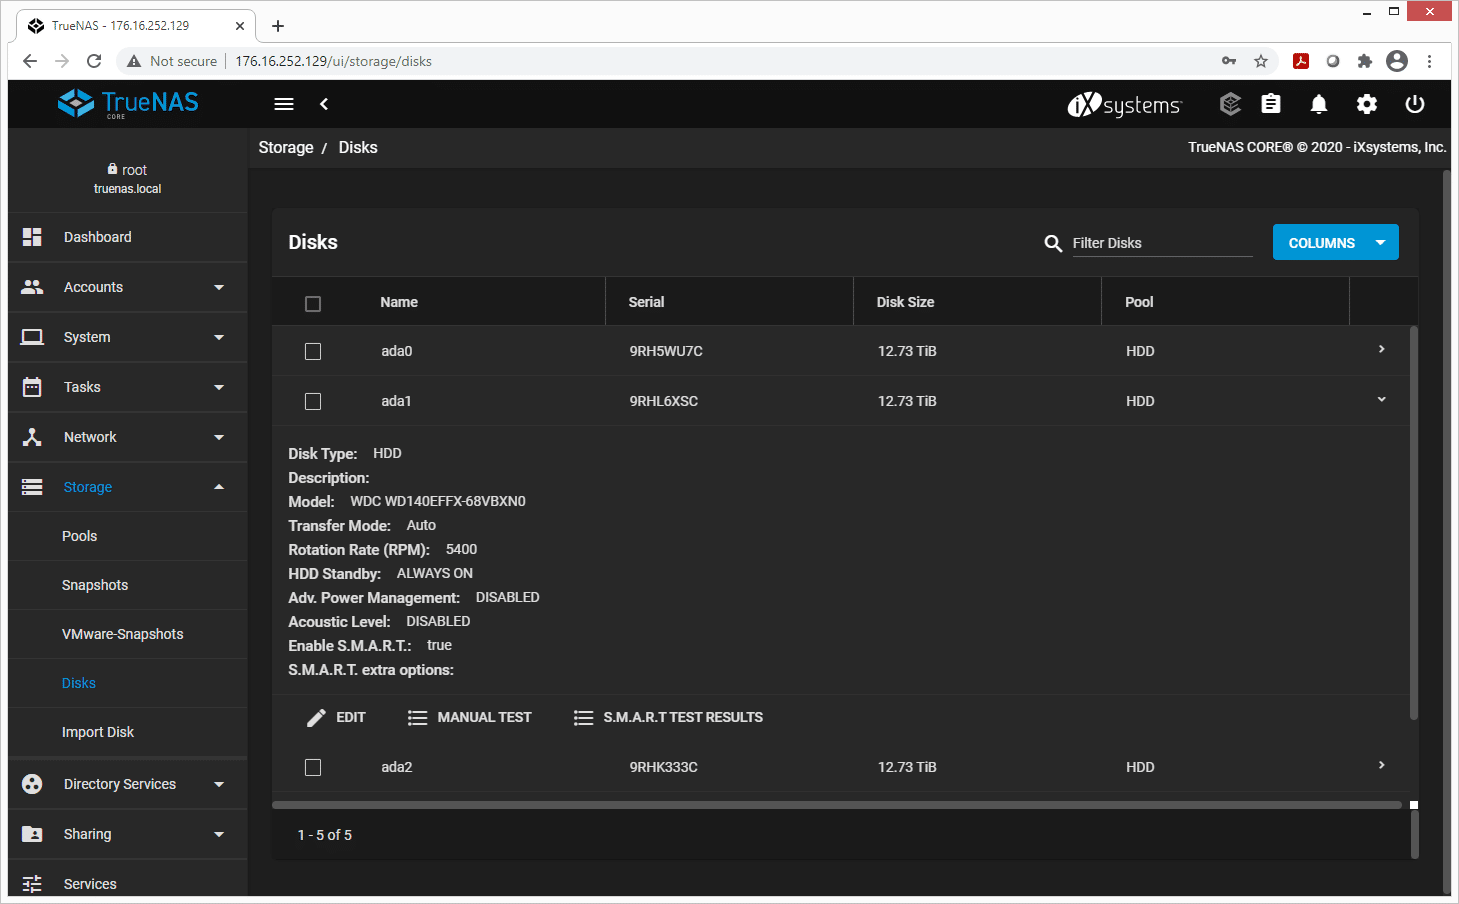
Say we want to look at the actual storage hardware. Users can click on disk and get all the information such as the name, its serial number, its size, the pool it is in, as well as more specific things like model number, transfer mode, RPM, standby, power management, and SMART.
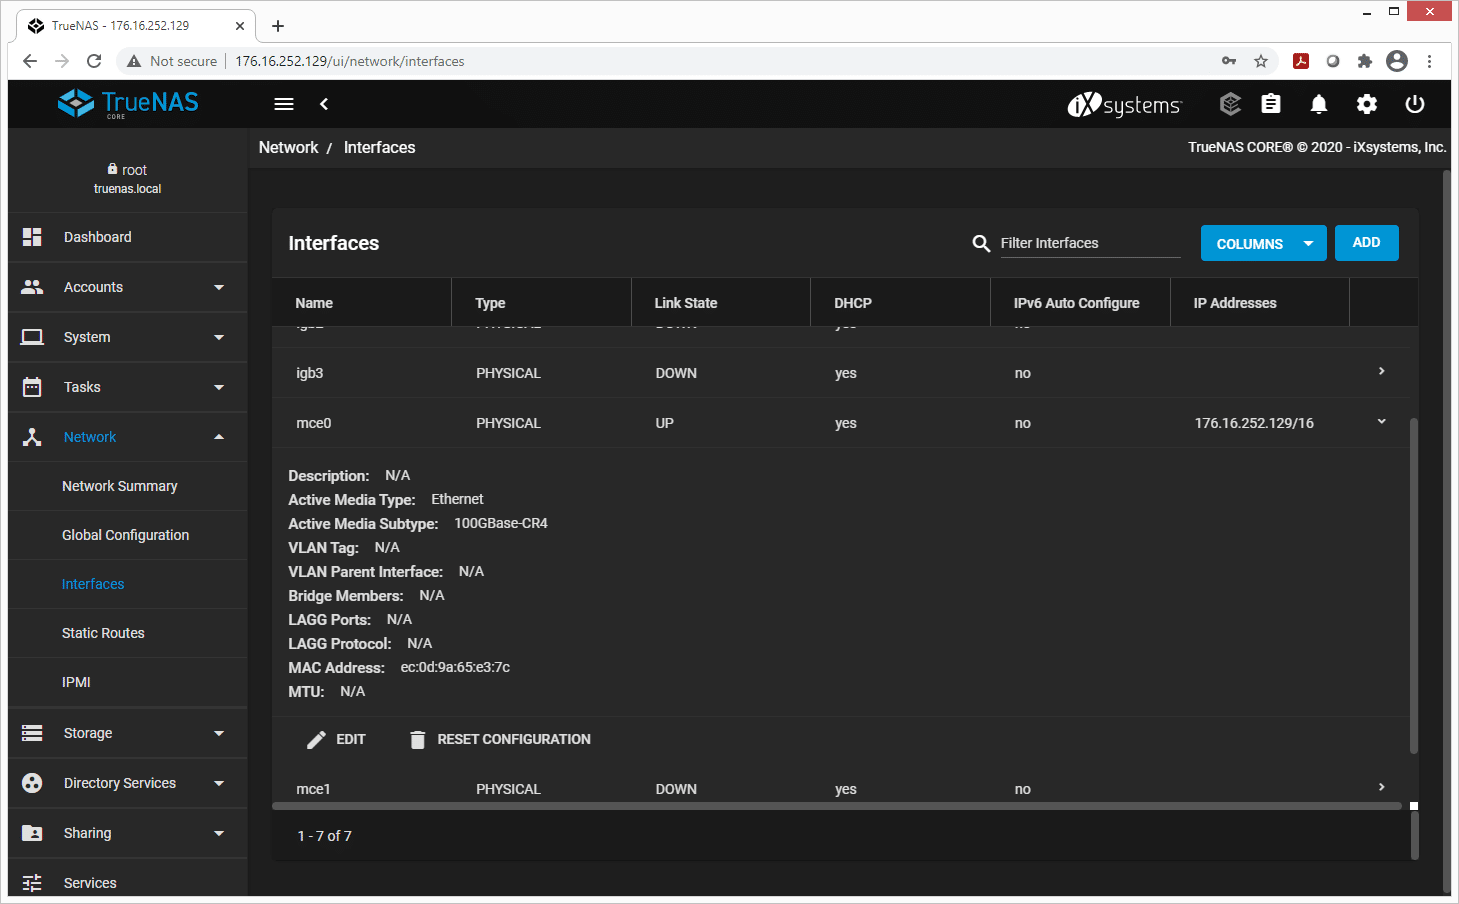
The last thing we’ll touch on is networking. Partly because it is a good aspect to look at for testing and partly because we want to humblebrag on our 100GbE. The Network tab brings up five sub-tabs: Network Summary, Global Configuration, Interfaces, Static Routes, and IPMI. Clicking on the Interfaces sub-tab we get information such as the name, type, link-state (up or down), DHCP, IPv6 auto-configuration, and IP address. As always, we can drill down further with the active media type, media subtype, VLAN tag, VLAN parent interface, bridge members, LAGG ports, LAGG protocol, MAC Address, and MTU.
TrueNAS CORE 12 Configuration
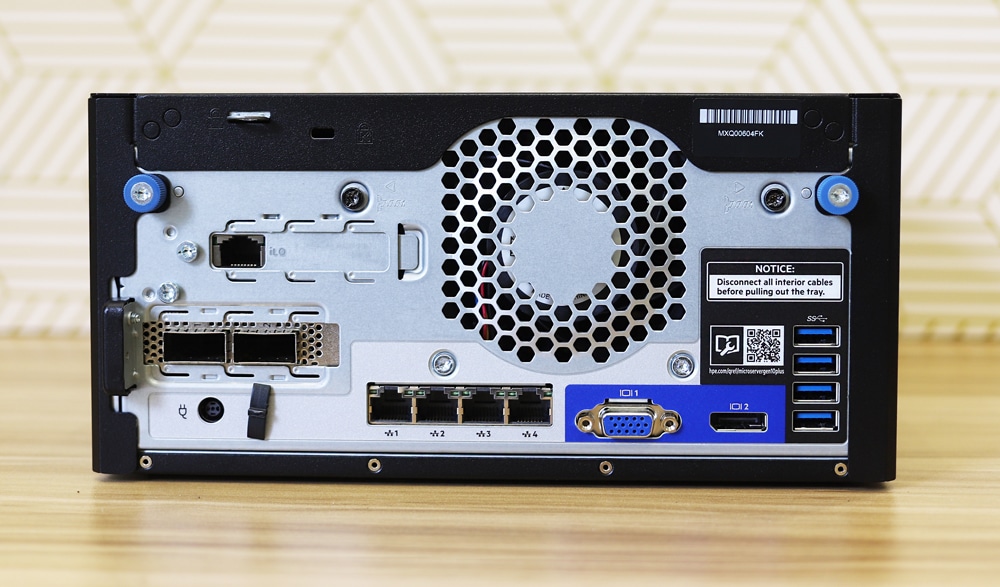
To effectively stress the HPE ProLiant MicroServer Gen10 Plus, we filled the open PCIe slot with a Mellanox ConnectX-5 100GbE network card. While 25GbE is roughly where the CPUs start to get capped out on I/O load, it was interesting to see how far up the chain of components the small platform can support.
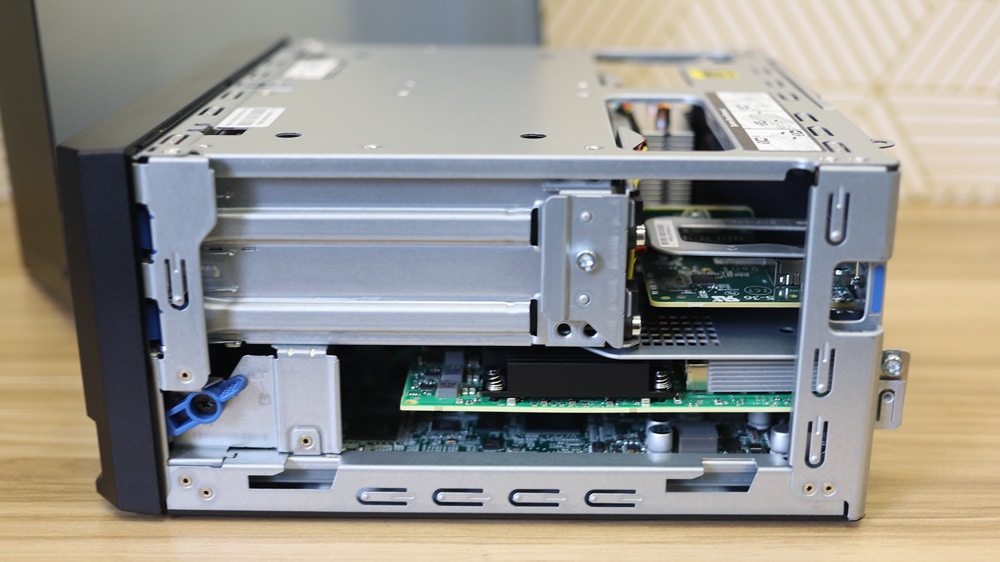
For drive configuration, we utilized all 4 disk bays for storage. We used an internal USB port for the TrueNAS CORE installation, with a higher quality USB thumb drive. While this isn’t fully recommended versus using a SATA or SAS drive, sticking with a name brand high-quality drive can help mitigate risks.
For our disks, we used a batch of 14TB WD Red HDDs for our spinning media group and 960GB Toshiba HK3R2 SSDs for our flash group. Each four-disk assortment was provisioned into a RAID-Z2 pool, allowing for two disk failures. We felt this was a good compromise at looking at traditional deployment types in production environments.
From those two groups, we then split testing into two more configurations. The first was a default configuration with LZ4 compression enabled and deduplication off. The second was a more space-savings tilt with ZSTD compression and deduplication enabled. Our goal was to show the performance impact of choosing hard drives or flash, as well as how much of a hit you need to factor in if you want stronger levels of data reduction. Not all deployments of TrueNAS need deduplication enabled, as it does have a significant performance impact associated with it. TrueNAS even warns you before turning it on.
Some deployments do warrant deduplication though, in areas where either flash or spinning media are leveraged. In a flash configuration, for example, VDI deployments can easily find space savings with deduplication on given the multiple base copies of each VM. Spinning media can even take advantage of it too, such as in the example of using the system as a backup target. Many traditional NAS systems without compression or deduplication get excluded in backup deployments since the cost of storing that much data gets too prohibitive. In these areas a hit to performance, but it staying fast enough makes it completely worth it.
A Word on LZ4 vs. ZSTD
LZ4
While there are many compression tools available, LZ4 has shown to be a fast and lightweight compression format with a dynamic API that makes integration relatively simple. Adopted by several storage solutions, companies such as TrueNAS have made LZ4 an option to better save time and space. While not the highest compression, LZ4 focuses on speed and efficiency.
ZSTD
ZSTD is a newer more efficient lossless compression that offers better compression ratios with better decompression speeds than LZ4, however, falls behind in compression speeds while offering deduplication and long search capability. ZSTD has been built into the Linux Kernel since V4.14 (Nov 2017). ZSTD has been widely adopted as compression of choice due in no small part to its excellent multi-thread performance.
TrueNAS CORE 12 Performance
We tested the HPE MicroServer Gen10 Plus running TrueNAS CORE 12 using a 100GbE network interface, connected through our 100G native Ethernet fabric. For a loadgen we used a bare-metal Dell EMC PowerEdge R740xd running Windows Server 2019 connected to the same fabric with a 25GbE network card.
While the interfaces on each side didn’t quite match, the Microserver was topped out on CPU regardless. At 2500-3000MB/s transfer speeds, the CPU inside the Gen10 Plus was floating at 95-100% usage. The goal here was to fully saturate the MicroServer, and show how far speeds would drop when ramping up deduplication and compression levels.
SQL Server Performance
StorageReview’s Microsoft SQL Server OLTP testing protocol employs the current draft of the Transaction Processing Performance Council’s Benchmark C (TPC-C), an online transaction processing benchmark that simulates the activities found in complex application environments. The TPC-C benchmark comes closer than synthetic performance benchmarks to gauging the performance strengths and bottlenecks of storage infrastructure in database environments.
Each SQL Server VM is configured with two vDisks: 100GB volume for boot and a 500GB volume for the database and log files. From a system resource perspective, we configured each VM with 16 vCPUs, 64GB of DRAM and leveraged the LSI Logic SAS SCSI controller. While our Sysbench workloads tested previously saturated the platform in both storage I/O and capacity, the SQL test looks for latency performance.
SQL Server Testing Configuration (per VM)
- Windows Server 2012 R2
- Storage Footprint: 600GB allocated, 500GB used
- SQL Server 2014
-
- Database Size: 1,500 scale
- Virtual Client Load: 15,000
- RAM Buffer: 48GB
- Test Length: 3 hours
-
- 2.5 hours preconditioning
- 30 minutes sample period
With the all-flash configuration leveraging four of the Toshiba HK3R2 960GB SSDs in RAID-Z2 with LZ4 compression on and deduplication off, we ran a single SQL Server VM instance on the platform off a 1TB iSCSI share running inside our VMware ESXi environment running on a Dell EMC PowerEdge R740xd.
The VM operated at a performance level of 3099.96 TPS, which was pretty decent considering this workload is generally only run on much larger storage arrays.

Average Latency in the SQL Server test with 1VM running averaged 99ms.

Sysbench MySQL Performance
Our first local-storage application benchmark consists of a Percona MySQL OLTP database measured via SysBench. This test measures average TPS (Transactions Per Second), average latency, and average 99th percentile latency as well.
Each Sysbench VM is configured with three vDisks: one for boot (~92GB), one with the pre-built database (~447GB), and the third for the database under test (270GB). From a system resource perspective, we configured each VM with 16 vCPUs, 60GB of DRAM and leveraged the LSI Logic SAS SCSI controller.
Sysbench Testing Configuration (per VM)
- CentOS 6.3 64-bit
- Percona XtraDB 5.5.30-rel30.1
-
- Database Tables: 100
- Database Size: 10,000,000
- Database Threads: 32
- RAM Buffer: 24GB
- Test Length: 3 hours
-
- 2 hours preconditioning 32 threads
- 1 hour 32 threads
Similar to our SQL Server test above, we also used the configuration leveraging four of the Toshiba HK3R2 960GB SSDs in RAID-Z2 with LZ4 compression on and deduplication off for our Sysbench test. We ran a single Sysbench VM instance on the platform off a 1TB iSCSI share running inside our VMware ESXi environment running on a Dell EMC PowerEdge R740xd.
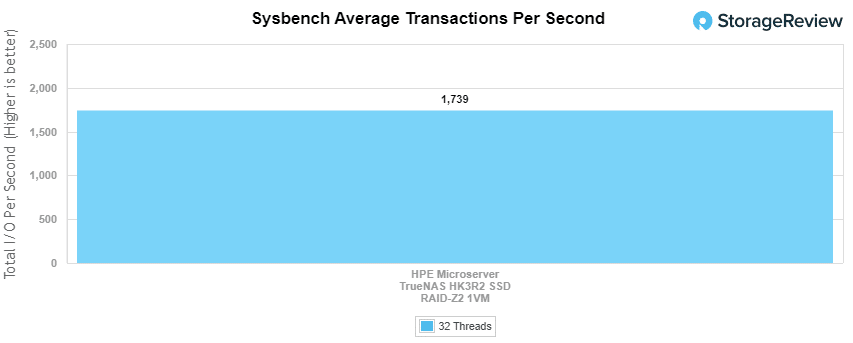
Over the course of the Sysbench workload, we saw some variation in the workload performance. Generally, ZFS brings a large weight over the storage I/O, which we saw as performance varied from 750 TPS to 2800 TPS every few seconds. At the end of the 1-hour sample, we measured an average speed of 1,738 TPS.
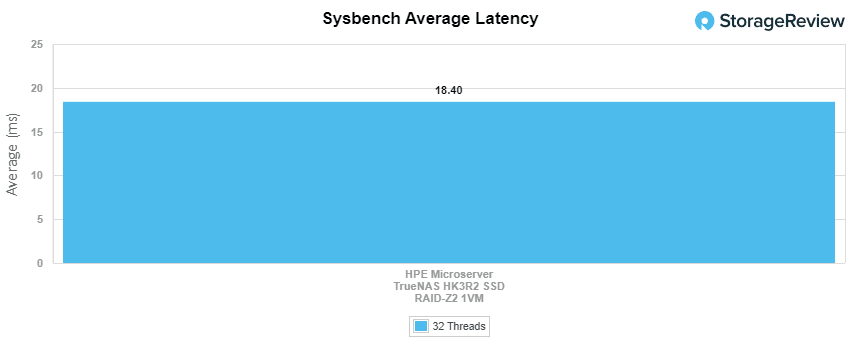
Average latency from the single Sysbench VM measured 18.40ms over the duration of the workload.
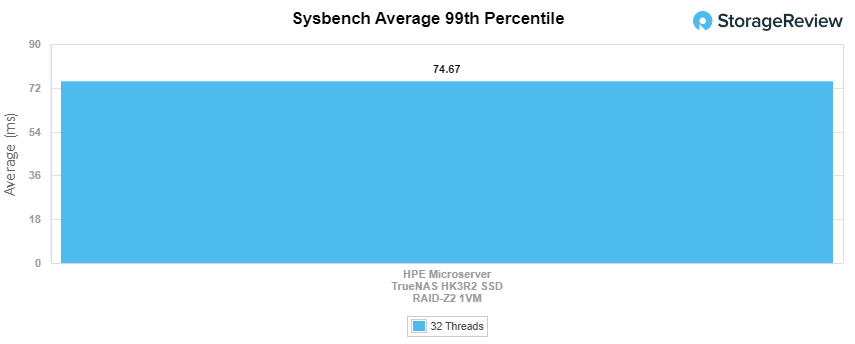
The average 99th percentile latency measured 74.67ms.
Enterprise Synthetic Workload Analysis
Our enterprise shared storage and hard drive benchmark process preconditions each drive into steady-state with the same workload the device will be tested with under a heavy load of 16 threads with an outstanding queue of 16 per thread, and then tested in set intervals in multiple thread/queue depth profiles to show performance under light and heavy usage. Since NAS solutions reach their rated performance level very quickly, we only graph out the main sections of each test.
Preconditioning and Primary Steady-State Tests:
- Throughput (Read+Write IOPS Aggregate)
- Average Latency (Read+Write Latency Averaged Together)
- Max Latency (Peak Read or Write Latency)
- Latency Standard Deviation (Read+Write Standard Deviation Averaged Together)
Our Enterprise Synthetic Workload Analysis includes four profiles based on real-world tasks. These profiles have been developed to make it easier to compare to our past benchmarks as well as widely-published values such as max 4k read and write speed and 8k 70/30, which is commonly used for enterprise drives.
- 4K
- 100% Read or 100% Write
- 100% 4K
- 8K 70/30
- 70% Read, 30% Write
- 100% 8K
- 8K (Sequential)
- 100% Read or 100% Write
- 100% 8K
- 128K (Sequential)
- 100% Read or 100% Write
- 100% 128K
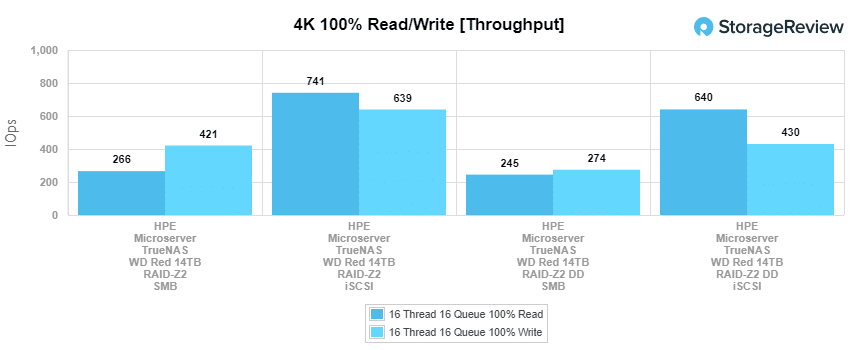
In 4K HDD performance with ZSTD compression, the HPE Microserver Gen10+ TrueNAS hit 266 IOPS read and 421 IOPS write in SMB, while iSCSI recorded 741 IOPS read and 639 IOPS write. With deduplication enabled, the HPE Microserver showed 245 IOPS read 274 IOPS write (SMB) and 640 IOPS read and 430 IOPS write (iSCSI).
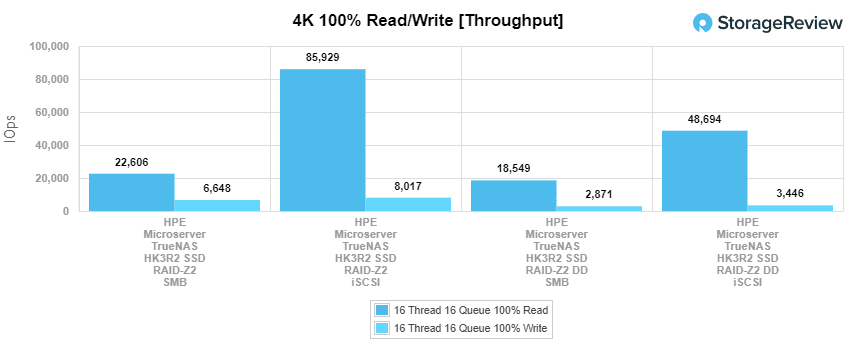
Switching to 4K SDD performance with ZSTD compression, the HPE Microserver Gen10+ TrueNAS was able to reach 22,606 IOPS read and 6,648 IOPS write in SMB, while iSCSI showed 85,929 IOPS read and 8,017 IOPS write. With deduplication enabled, the HPE Microserver showed 18,549 IOPS read 2,871 IOPS write (SMB) as well as 48,694IOPS read and 3,446 IOPS write (iSCSI).
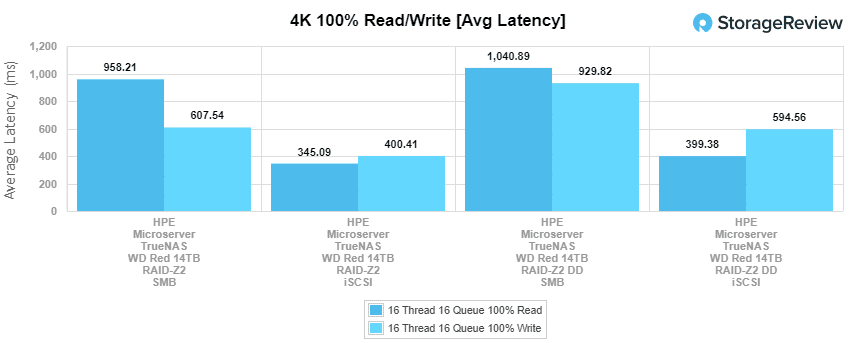
With average latency performance using the ZSTD compression HDD configuration, the HPE Microserver hit 958.2ms read and 607.5ms write in SMB, and 345.1ms read and 400.4ms write in iSCSI. Enabling deduplication showed 1,041ms read and 929.8ms write (SMB) and 399.4ms read and 594.6ms write (iSCSI).
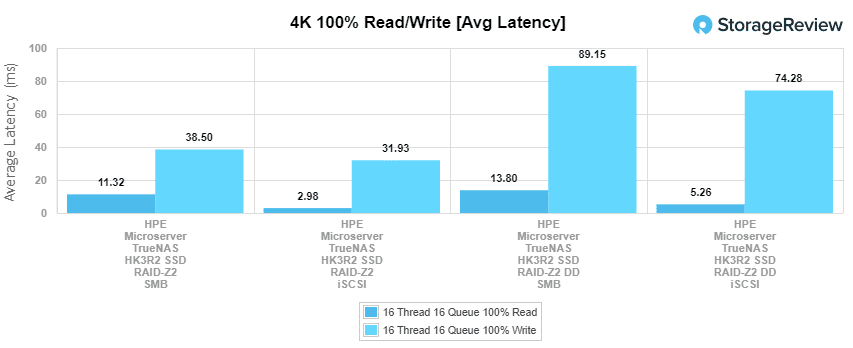
Looking at SSD performance for the same test, the HPE Microserver hit 11.323ms read and 38.5ms write in SMB, and 2.978ms read and 31.9ms write in iSCSI. Enabling deduplication had 13.8ms read and 89.2ms write (SMB) and 74.3ms read and 5.3ms write (iSCSI).
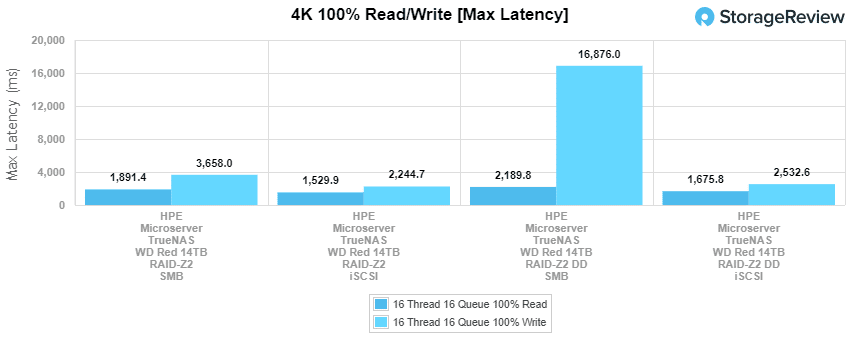
In max latency, the HDD configuration using ZSTD compression reached 1,891.4ms read and 3,658ms write for SMB, while hitting 1,529.9ms read and 2,244.7ms write in iSCSI. With deduplication, the HPE server hit 2189.8ms read and 16876ms (SMB), while iSCSI reached 1,675.8ms read and 2532.6ms write.
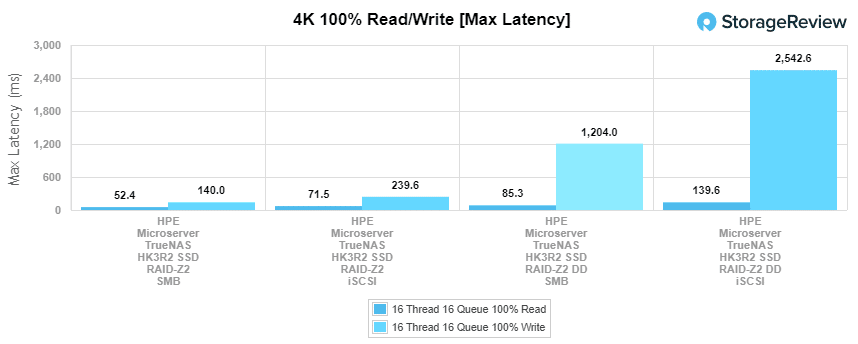
Switching to our SDD configuration using ZSTD compression, the HPE microserver reached 52.389ms read and 140ms write for SMB while hitting 71.5ms read and 239.6ms write in iSCSI in max latency. With deduplication enabled, the HPE server hit 85.3ms read and 1,204ms (SMB), while iSCSI reached 139.6ms read and 2,542.6ms write (iSCSI).
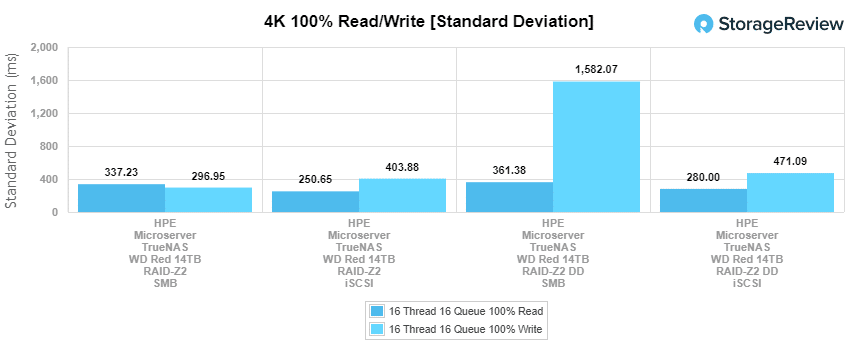
For our last 4K test, we looked at standard deviation. In our ZSTD compression HDD configuration, we recorded figures of 337.226ms write and 296.95ms read in SMB while iSCSI hit 250.6ms write and 403.9ms read in iSCSI. With deduplication enabled, the performance showed 361.4ms read and 1,582.1ms write in SMB and 280ms write and 471.1ms read in iSCSI.
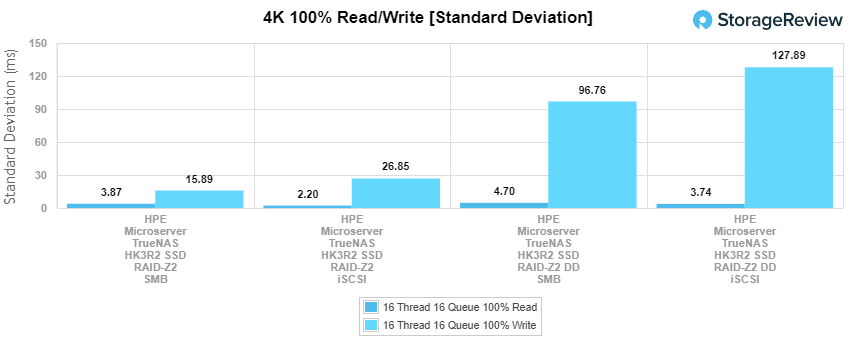
In our SDD configuration (ZSTD compression), we recorded figures of 3.9ms write and 15.9ms read in SMB while iSCSI hit 2.2ms write and 26.8ms read in iSCSI. With deduplication enabled, the performance showed 4.701ms read and 96.8ms write in SMB and 3.7ms write and 127.9ms read in iSCSI.
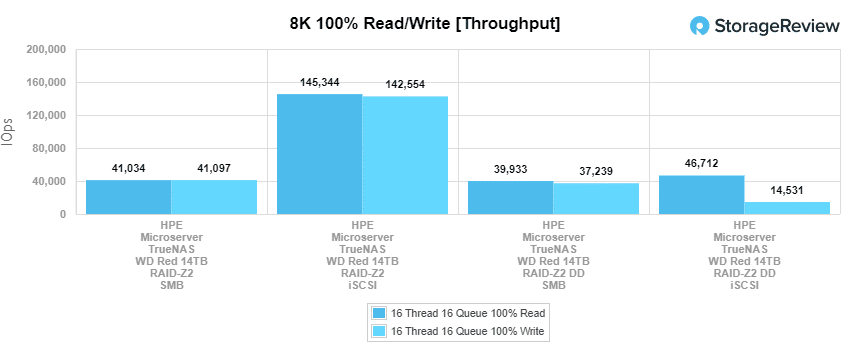
Our next benchmark measures 100% 8K sequential throughput with a 16T16Q load in 100% read and 100% write operations. Using our HDD configuration (with ZSTD compression), the HPE Microserver Gen10+ TrueNAS was able to reach 41,034 IOPS read and 41,097 IOPS write in SMB and 145,344 IOPS read and 142,554 IOPS read in iSCSI. Switching on deduplication, the microserver recorded 39,933 IOPS write and 37,239 IOPS read in SMB, while iSCSI saw 46,712 IOPS read and 14,531 IOPS write.
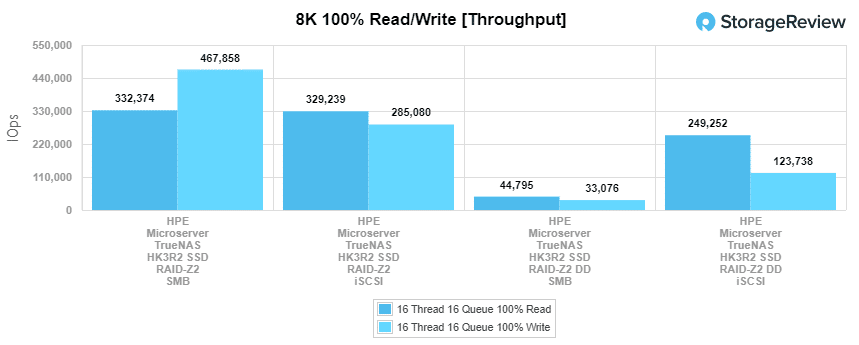
Switching to our SSD configuration (with ZSTD compression), the HPE Microserver Gen10+ TrueNAS hit 33,2374 IOPS read and 46,7858 IOPS write in SMB and 329,239 IOPS read and 285,080 IOPS read in iSCSI. Switching on deduplication, the microserver recorded 44,795 IOPS write and 33,076 IOPS read in SMB, while iSCSI saw 249,252 IOPS read and 123,738 IOPS write.
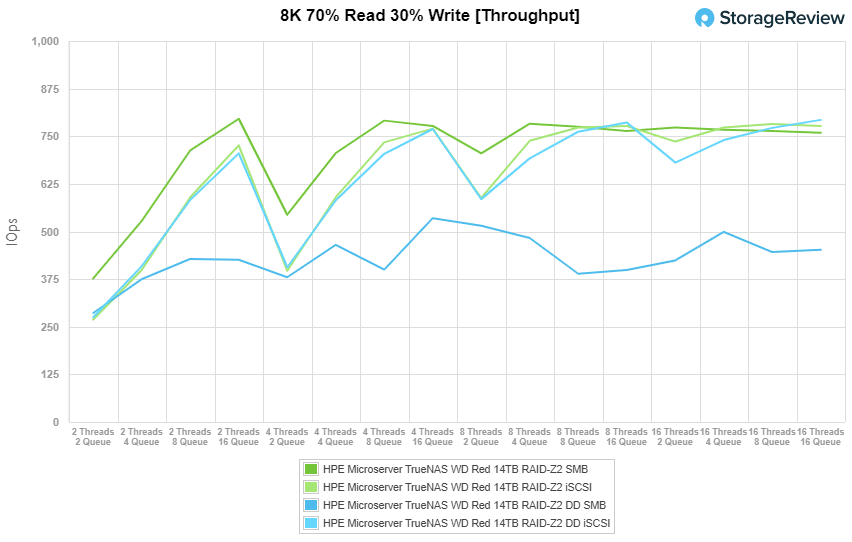
Compared to the fixed 16 thread, 16 queue max workload we performed in the 100% 4K write test, our mixed workload profiles scale the performance across a wide range of thread/queue combinations. In these tests, we span workload intensity from 2 thread/2 queue up to 16 thread/16 queue. With HDD throughput (ZSTD compression), SMB posted a range of 377 IOPS to 759 IOPS while iSCSI hit a range of 269 IOPS to 777 IOPS. With deduplication enabled, SMB showed a range of 286 IOPS to 452 IOPS, while iSCSI hit 275 IOPS to 793 IOPS.
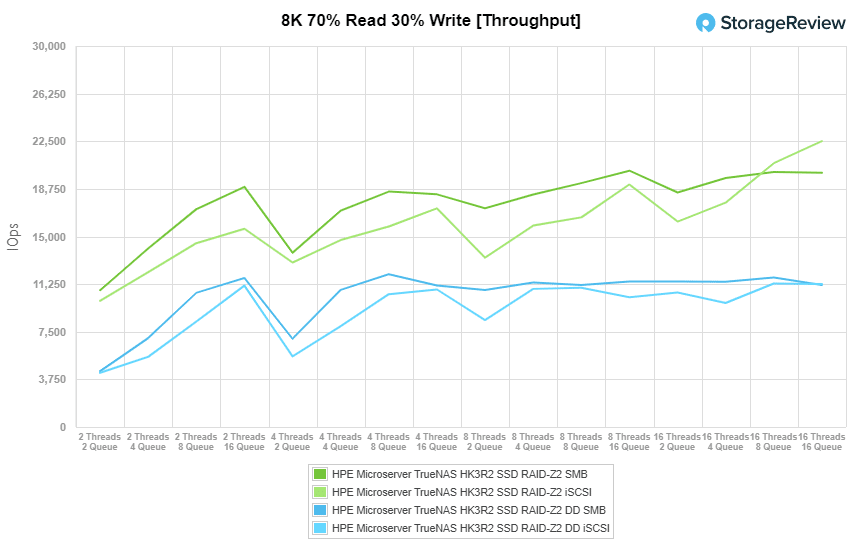
Looking at HDD throughput (ZSTD compression), SMB posted a range of 10,773 IOPS to 20,025 IOPS while iSCSI hit a range of 9,933 IOPS to 22,503 IOPS. With deduplication enabled, SMB showed a range of 4,401 IOPS to 11,187 IOPS, while iSCSI hit 4,269 IOPS to 11,251 IOPS.
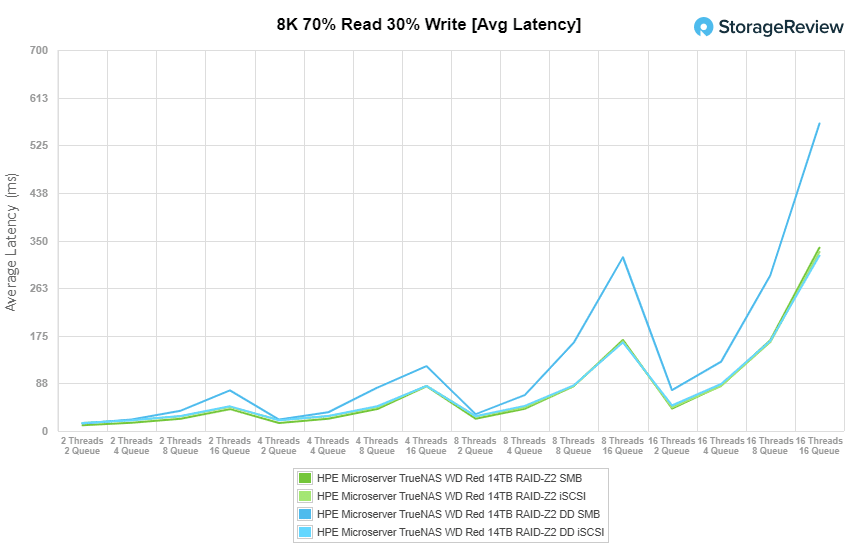
Looking at average latency performance figures in our HDD configuration (with ZSTD compression), the HPE microserver showed a range of 10.6ms to 336.8ms in SMB, while iSCSI recorded 14.8ms to 328.9ms. When enabling deduplication, the HPE Microserver Gen10+ TrueNAS showed a range of 14ms to 564.9ms in SMB and 14.5ms to 322.2ms in iSCSI.
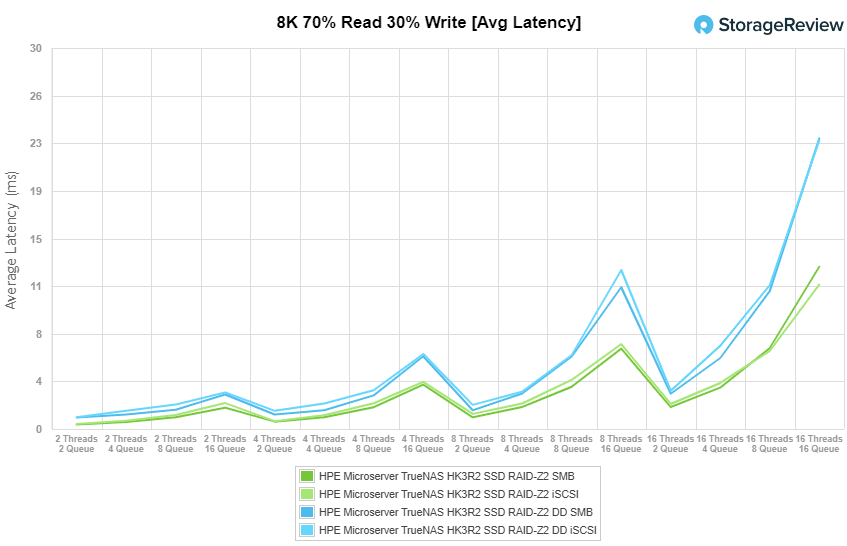
In our SSD configuration (with ZSTD compression), the HPE microserver showed a range of 0.36ms to 12.78ms in SMB, while iSCSI recorded 0.4ms to 11.37ms. With deduplication turned on, the HPE server showed a range of 0.9ms to 22.87ms in SMB and 0.93ms to 22.74ms in iSCSI.
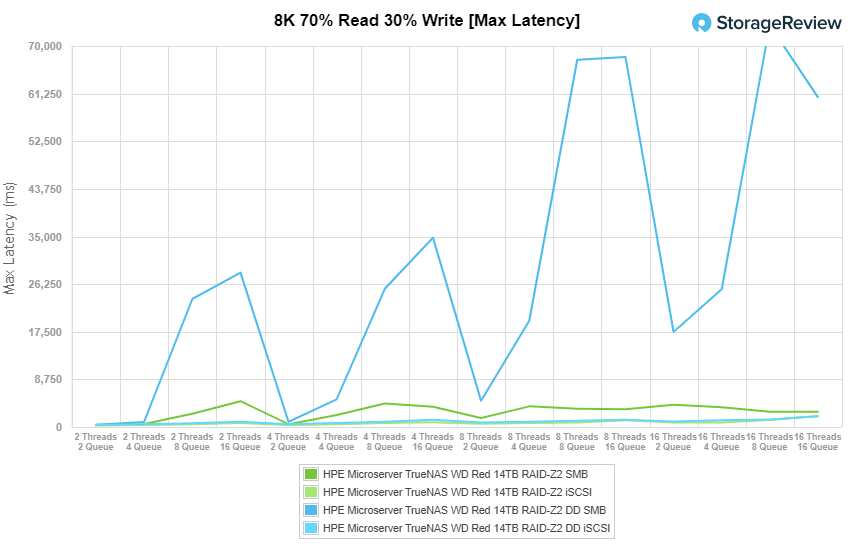
For maximum latency performance of the HDD configuration (with ZSTD compression), we saw 395.5ms to 2,790.5ms in SMB and 289ms to 2,008ms in iSCSI. With deduplication enabled, the HPE microserver posted 421.9ms to 60,607.7ms and 384.9ms to 1,977.81ms in SMB and iSCSI, respectively.
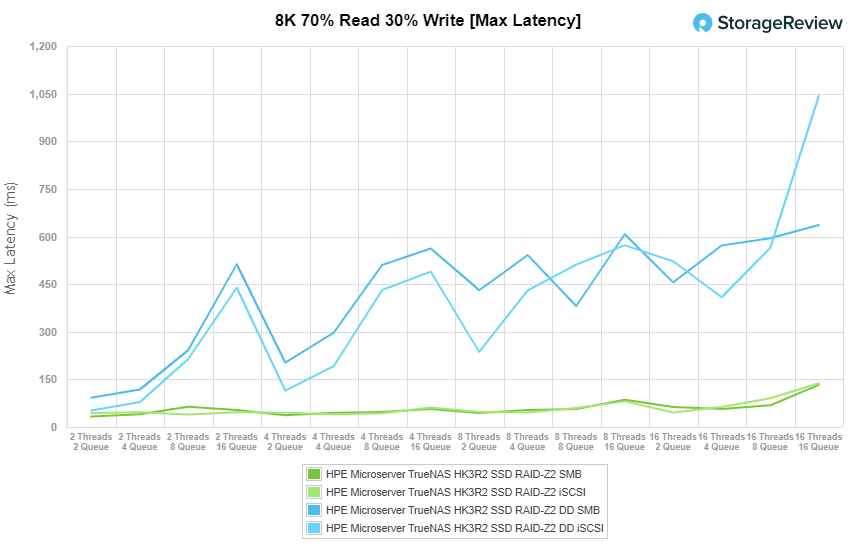
Looking at the SSD configuration (with ZSTD compression), we saw 33.35ms to 132.77ms in SMB and 44.19ms to 137.75ms in iSCSI. With deduplication enabled, the HPE microserver recorded a range of 91.82ms to 636.24ms (SMB) and 52.13ms to 1,042.27 (iSCSI).
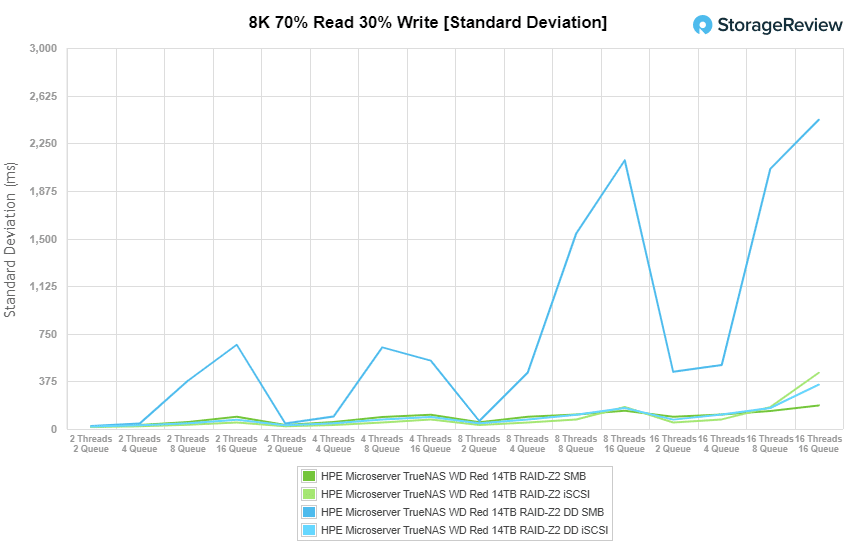
Looking at standard deviation, our HDD configuration (with ZSTD compression) recorded 19.08ms to 185.4ms in SMB and 15.46ms to 443ms in iSCSI. When we enabled deduplication, our HDD configuration posted 23.2ms to 2,435.2ms (SMB) and 20.5ms to 348.7ms (iSCSI).
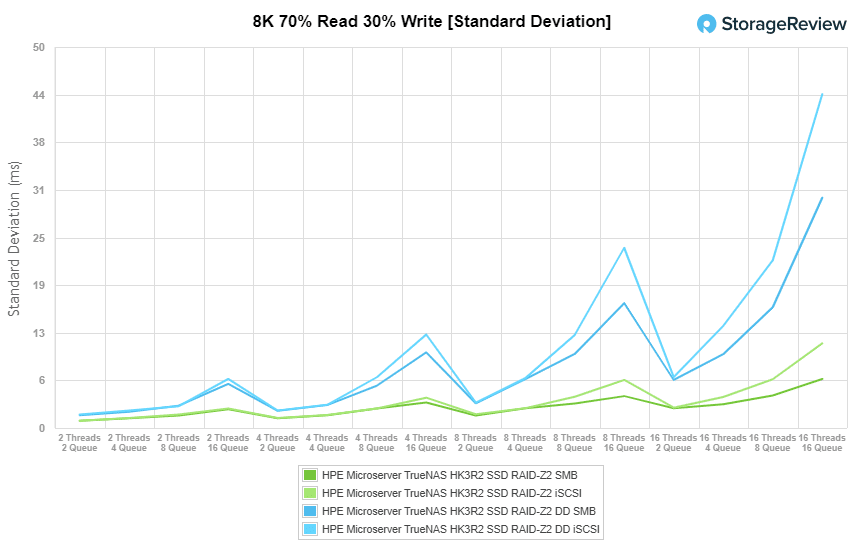
Looking at standard deviation results for our SSD configuration (with ZSTD compression), the microserver recorded 0.95ms to 6.44ms in SMB and 0.96ms to 11.1ms in iSCSI. When we enabled deduplication, our SSD configuration posted a range of 1.68ms to 30.22ms and 1.78ms to 43.8ms for SMB and iSCSI connectivity, respectively.
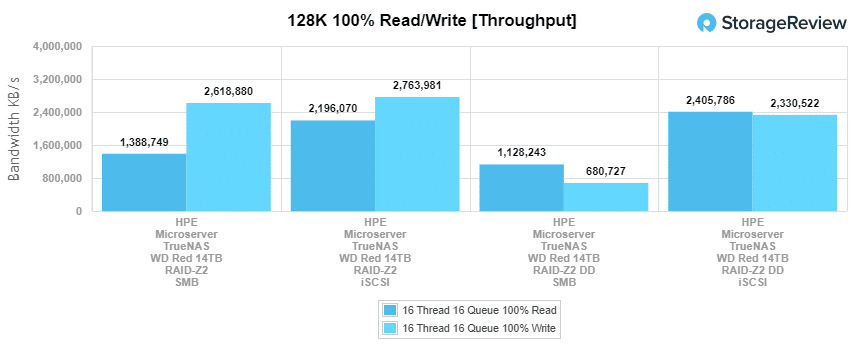
The last Enterprise Synthetic Workload benchmark is our 128K test, which is a large-block sequential test that shows the highest sequential transfer speed for a device. In this workload scenario, the HDD configuration (with ZSTD compression) posted 1.39GB/s read and 2.62GB/s write (SMB), and 2.2GB/s read and 2.76GB/s write (iSCSI). With deduplication enabled, the HPE microserver hit 1.13GB/s read and 681MB/s write in SMB and 2.4GB/s read and 2.33GB/s write in iSCSI.
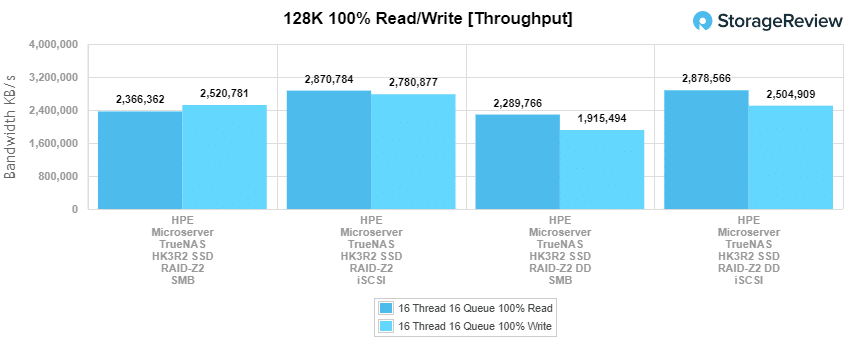
With our SSD configuration (ZSTD compression), the HPE microserver recorded 2.36GB/s read and 2.52GB/s write (SMB), and 2.87GB/s read and 2.78GB/s write (iSCSI). With deduplication enabled, the HPE microserver hit 2.29GB/s read and 1.92MB/s write in SMB and 2.88GB/s read and 2.5GB/s write in iSCSI.
Conclusion
Overall, TrueNAS CORE 12 when installed on the HPE ProLiant MicroServer Gen10 Plus can offer a very impressive storage solution. The server features four non-hot swappable LFF drive bays in the front that can be populated with either SATA 3.5” HDDs or SATA 2.5” SSDs, giving us a few options to build out a NAS with. Though very compact, you can equip the microserver with some pretty high-end enterprise-grade components, including Pentium G5420 or Xeon E-2224 CPUs and up to 32GB of ECC RAM to help take advantage of most features TrueNAS CORE has to offer.
The Xeon CPU and ECC memory are really what needs to be equipped when you want to leverage TrueNAS CORE and ZFS to their full potential. Its customizable build really makes it enjoyable to work with and its affordable price tag with the Xeon CPU (currently on sale for roughly $600) makes this a very versatile solution. It ends up being great for small businesses or the homelab community alike to combine TrueNAS CORE 12 software and hit a wide range of goals.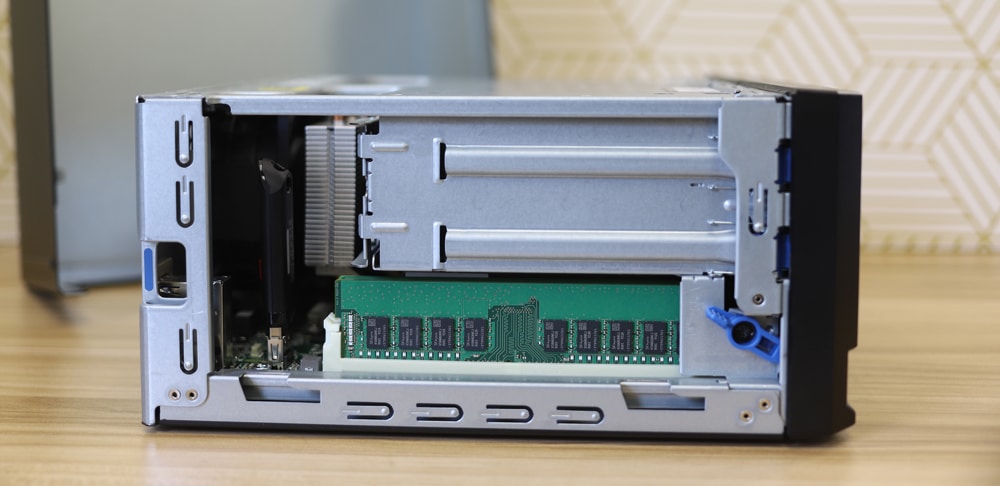
TrueNAS deployments can be used for several things with some need deduplication and some not. We decided to look at both. Not only that we outfitted the “NAS” with HDDs and SSDs. Of course, this doesn’t cover everything but it gives users a good idea of what to expect. Instead of rehashing the above, let’s look at some of the highlights for each media and ZSTD compression with and without deduplication. While we’re highlighting the high points, make sure you look over a performance section to get an idea of how the configuration you need will perform.
With spinning disks, the LZ4 compression gave us 741 IOPS read and 639 IOPS write in iSCSI in 4K read. Deduplication and ZSTD compression saw iSCSI numbers drop to 640 IOPS read and 430 IOPS write. 4K average latency saw iSCSI as the top performer with 345.1ms read and 400.4ms write and deduplication dropped the numbers 399.4ms read and 594.6ms write. 4K max latency saw iSCSI as the top-performing config with 1,529.9ms read and 2,244.7ms write, and with dedupe, it hit 1,675.8ms read and 2532.6ms write.
In 8K sequential, iSCSI was the top performer without dedupe on with 145,344 IOPS read and 142,554 IOPS read, however, SMB performed better in write (39,933 IOPS) and iSCSI did better in read (46,712 IOPS) with dedupe on. In our 128K large block iSCSI hit 2.2GB/s read and 2.76GB/s write with dedupe it saw 2.4GB/s read and 2.33GB/s write.
Now let’s move onto the flash highlights. With 4K throughput, iSCSI performed better with 85,929 IOPS read and 8,017 IOPS write, and with dedupe on it dropped to 48,694 IOPS read and 3,446 IOPS write. In non-dedupe 4K average latency iSCSI had lower latency with 2.978ms read and 31.9ms write, with dedupe SMB had better read 13.8ms read and iSCSI had better write with 5.3ms. In 4K max latency, SMB performed better with 52.389ms read and 140ms write, with dedupe on SMB still did better with 85.3ms read and 1,204ms write.
In 8K sequential, iSCSI slid back to the top with 329,239 IOPS read and 285,080 IOPS read to 249,252 IOPS read and 123,738 IOPS write with dedupe on. With the 128K sequential test we saw iSCSI hit 2.87GB/s read and 2.78GB/s write and with dedupe on the iSCSI numbers were 2.88GB/s read and 2.5GB/s write.
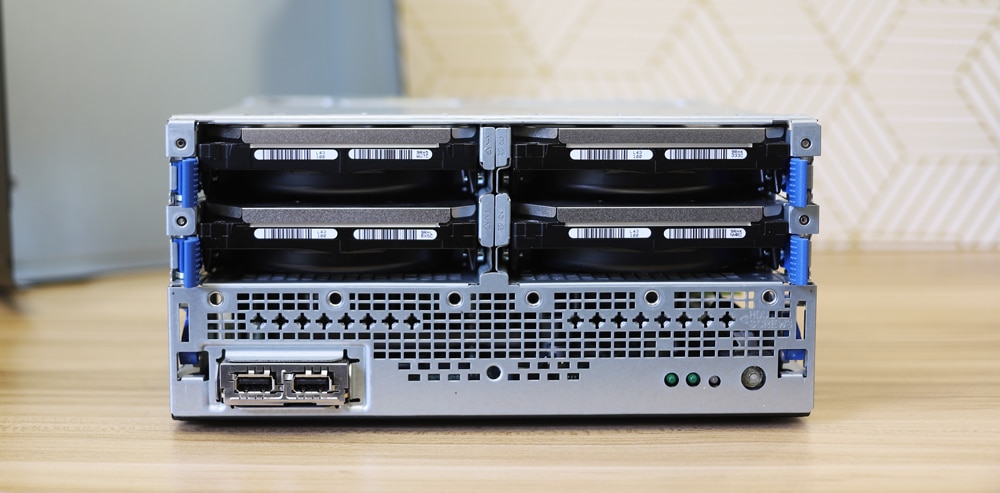
With the HPE ProLiant MicroServer Gen10 Plus, we were able to build a powerful 4-bay NAS with a tiny footprint for a reasonable price. To be fair, expansion capabilities are limited and the drives aren’t hot-swappable. And while the hardware itself is warrantied by HPE, you are on your own for support of the software and the system as a NAS. For those who want a standard solution procurement and warranty experience, iXsystems, and others offer fully built and supported systems. But as it is, these little configs are excellent for so many use cases ranging from edge computing to personal homelabs.
There’s a lot of ways to 4-Bay NAS. Synology and QNAP offer fantastic bundled solutions that are dead-simple to operate but are limited in terms of performance and tunability. If you need a lot of performance and capabilities in a small NAS, installing TrueNAS CORE 12 onto an HPE ProLiant MicroServer Gen10 Plus is a great, moderate-compromise, way to do it.
HPE ProLiant MicroServer Gen10 Plus
Engage with StorageReview
Newsletter | YouTube | LinkedIn | Instagram | Twitter | Facebook | TikTok | RSS Feed
